Apr 2025 – Present London
Senior Product Manager
Rainforest Alliance
Setting LandScale’s 2030 direction and doubling delivery speed
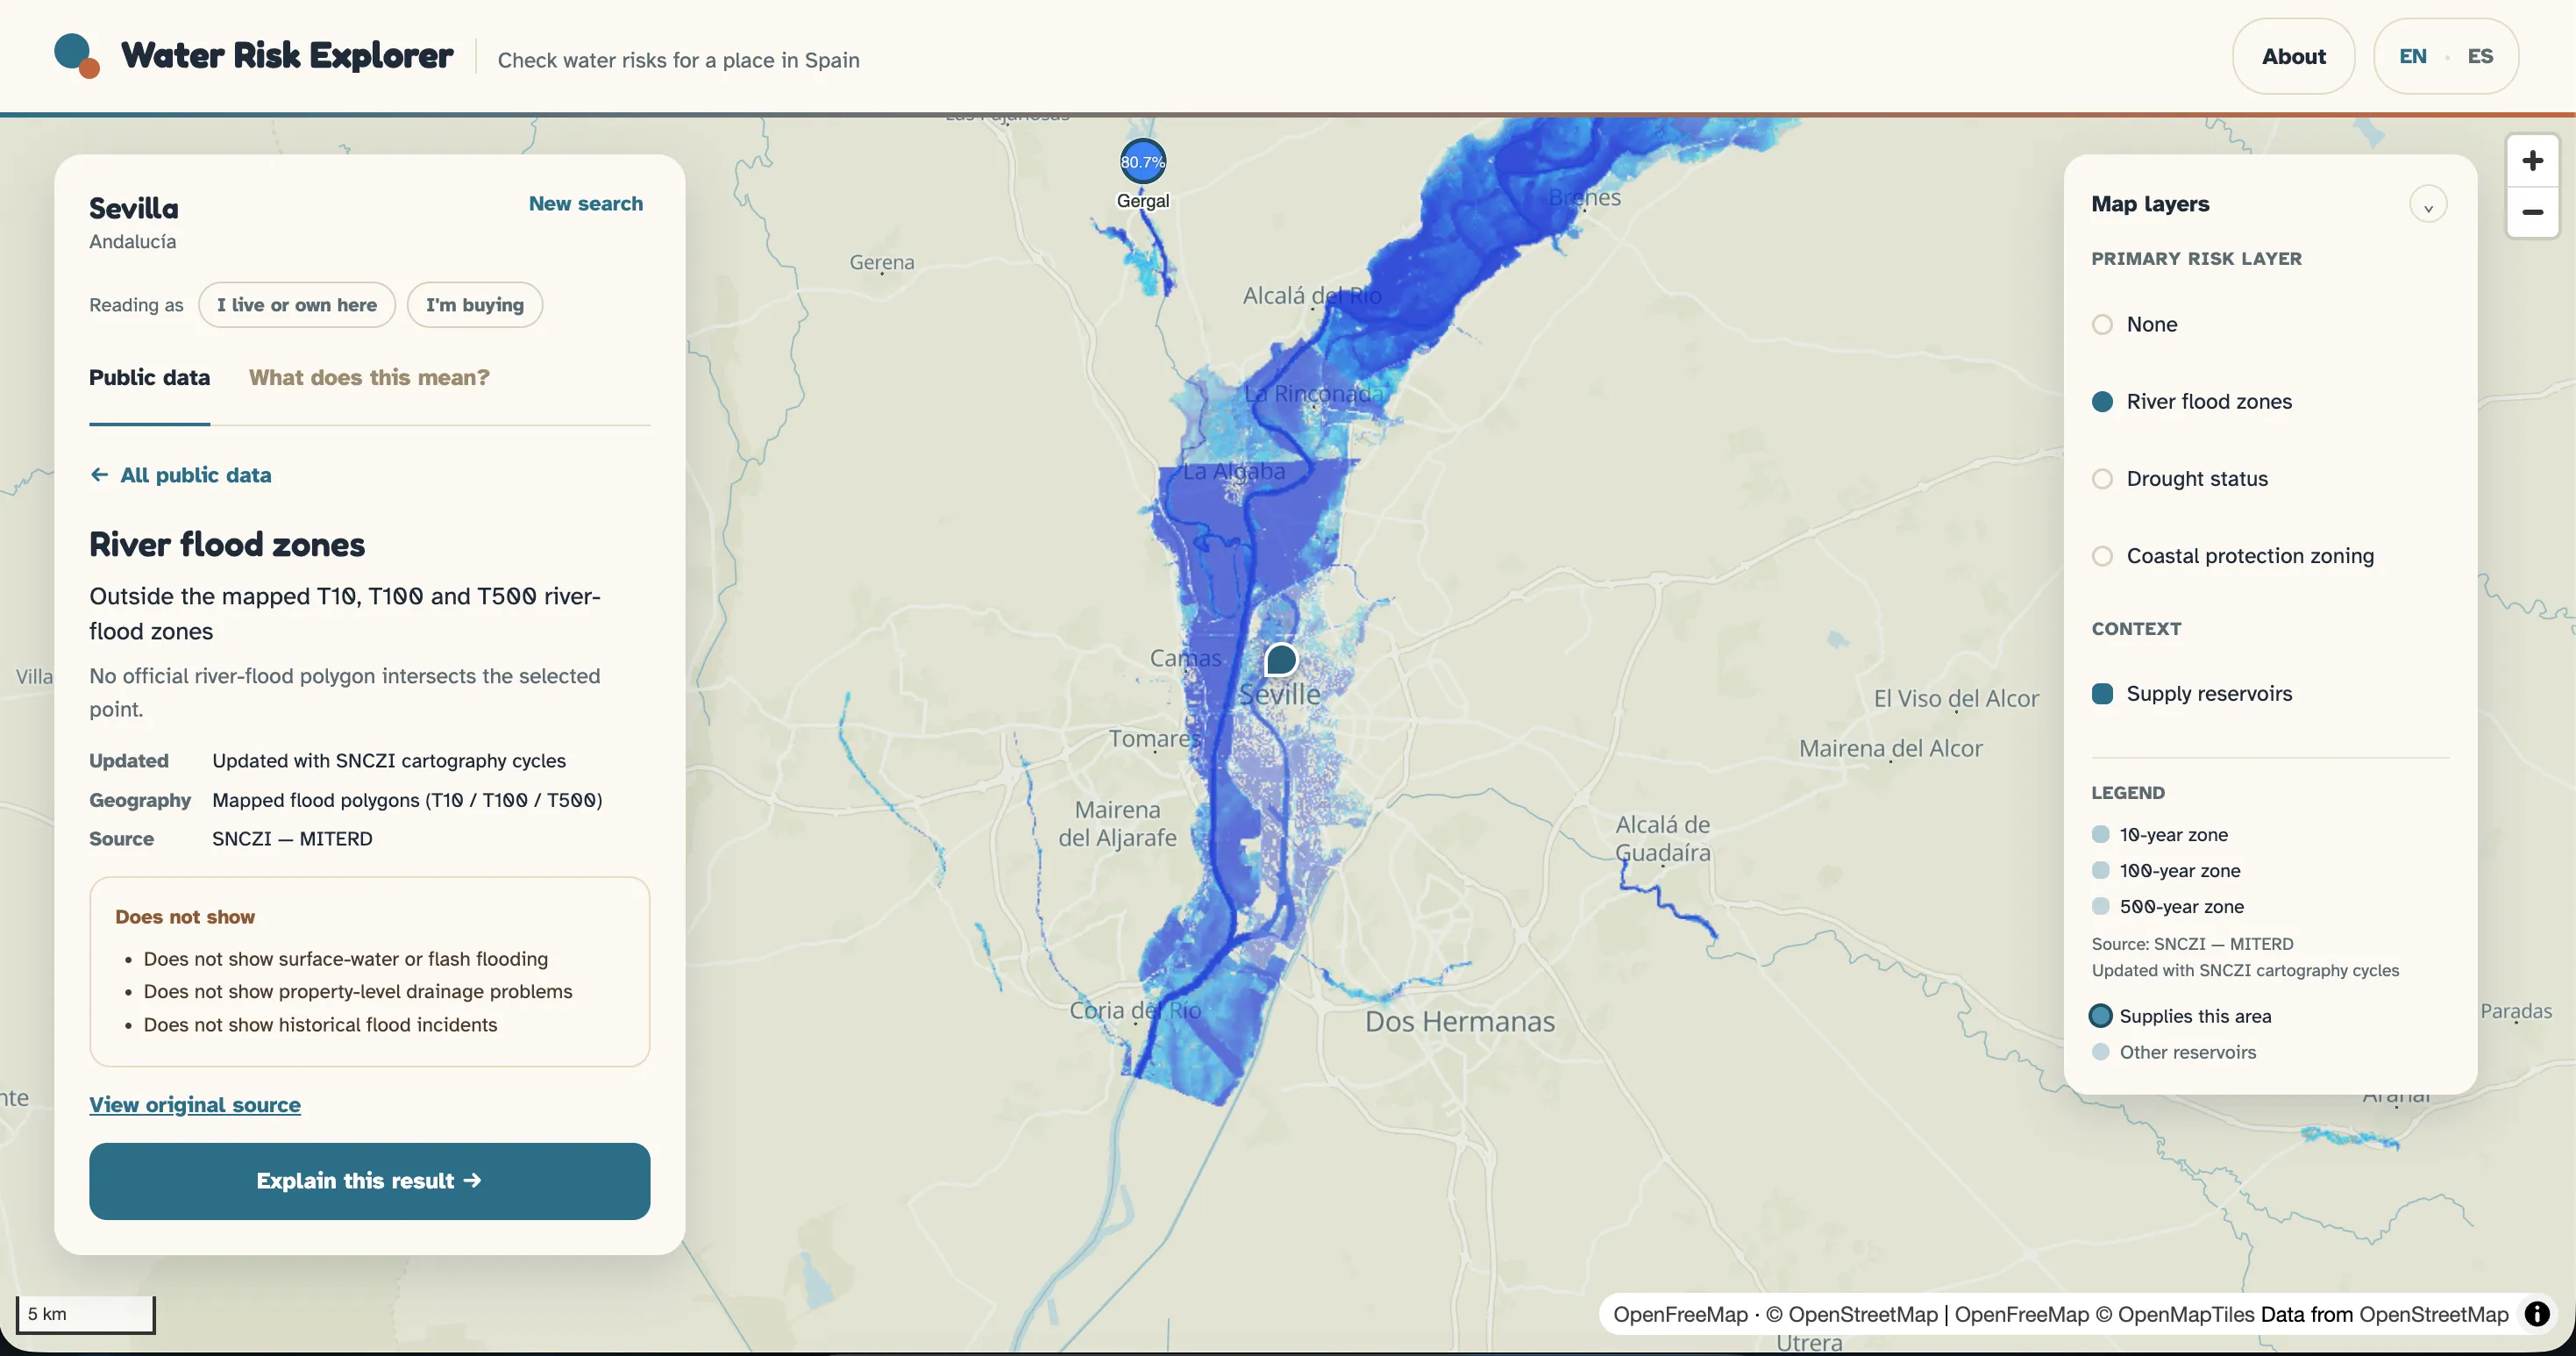
I lead product strategy and execution for LandScale, a global sustainability data platform. I defined its 2025–2030 direction, turned competing reporting, customer and donor needs into a focused roadmap, and built a cross-functional product team to deliver it. After challenging the existing delivery model, I selected and onboarded a new development partner, doubling delivery speed while materially improving product quality. I also translate TNFD, CDP, SBTN and SDG requirements into product capabilities, and lead work with WWF to shape its monitoring system into a white-labelled LandScale offering.
+ 2026
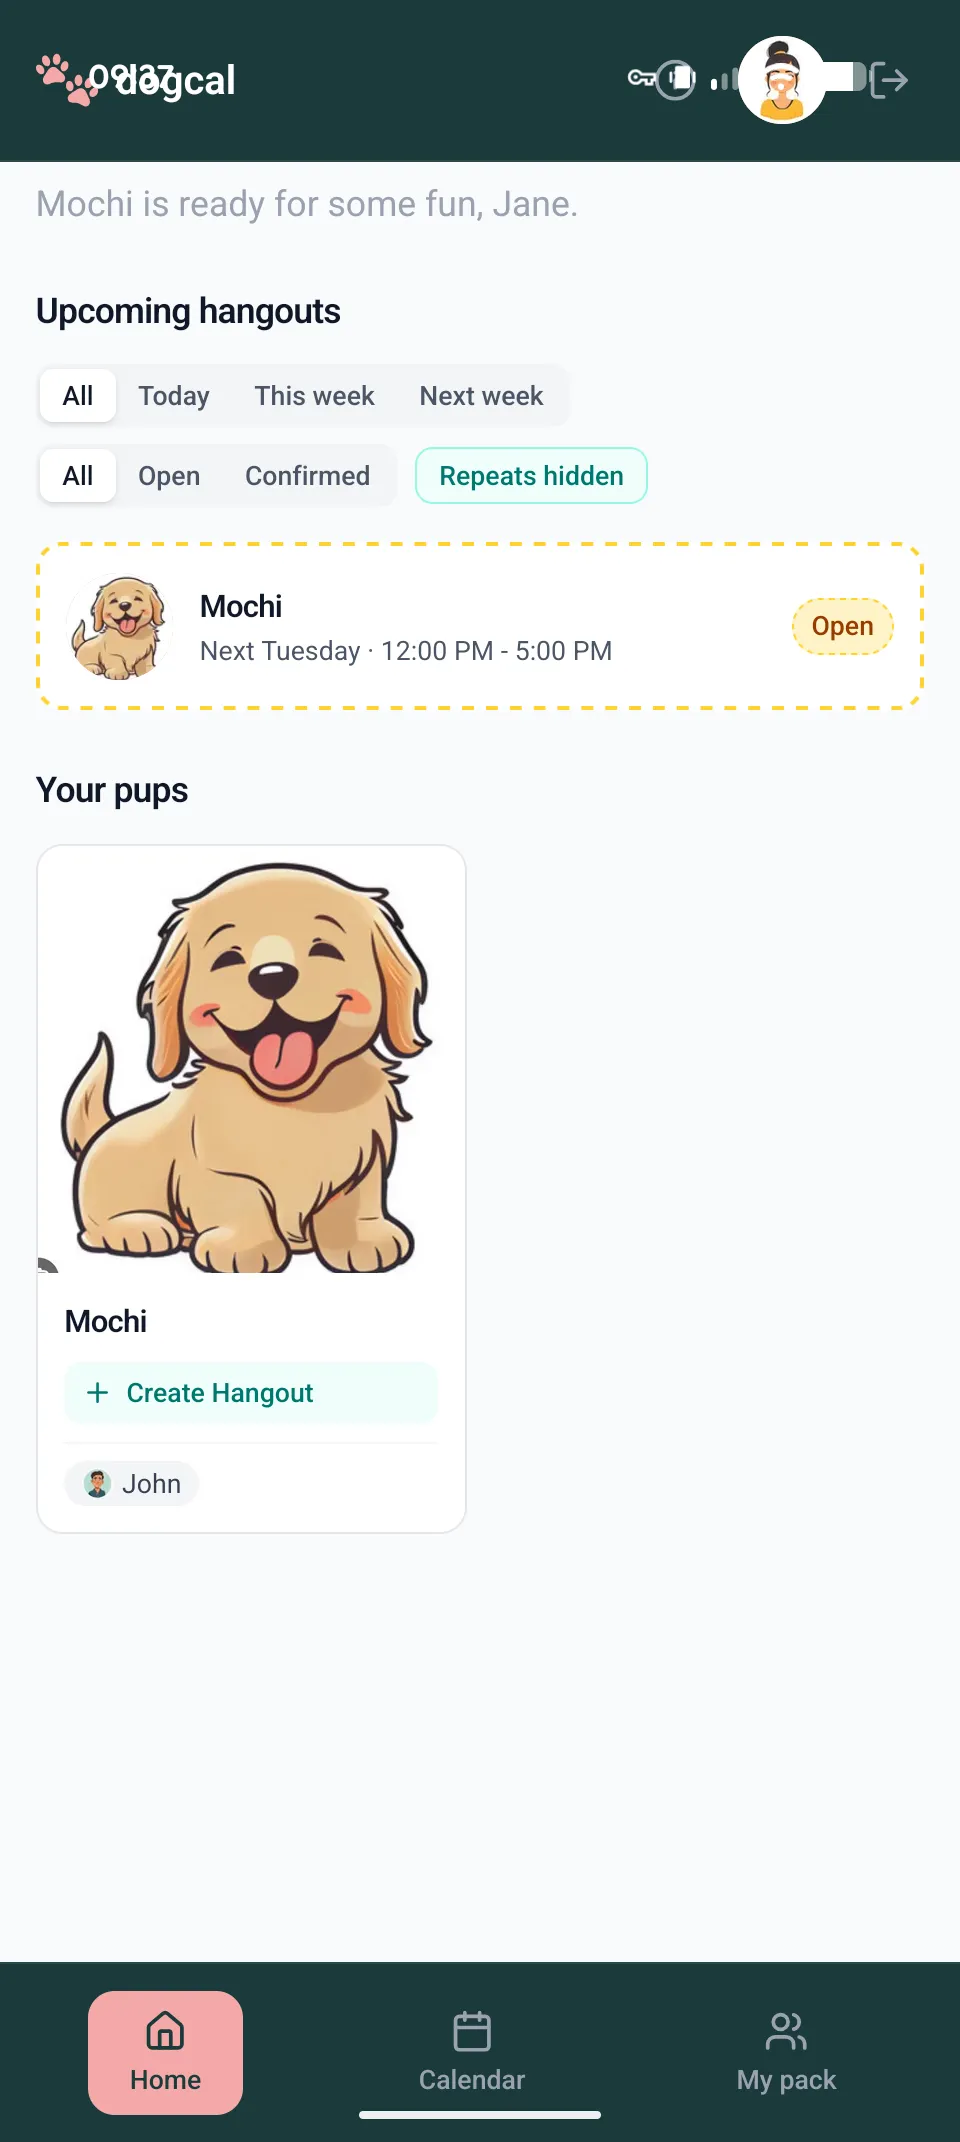
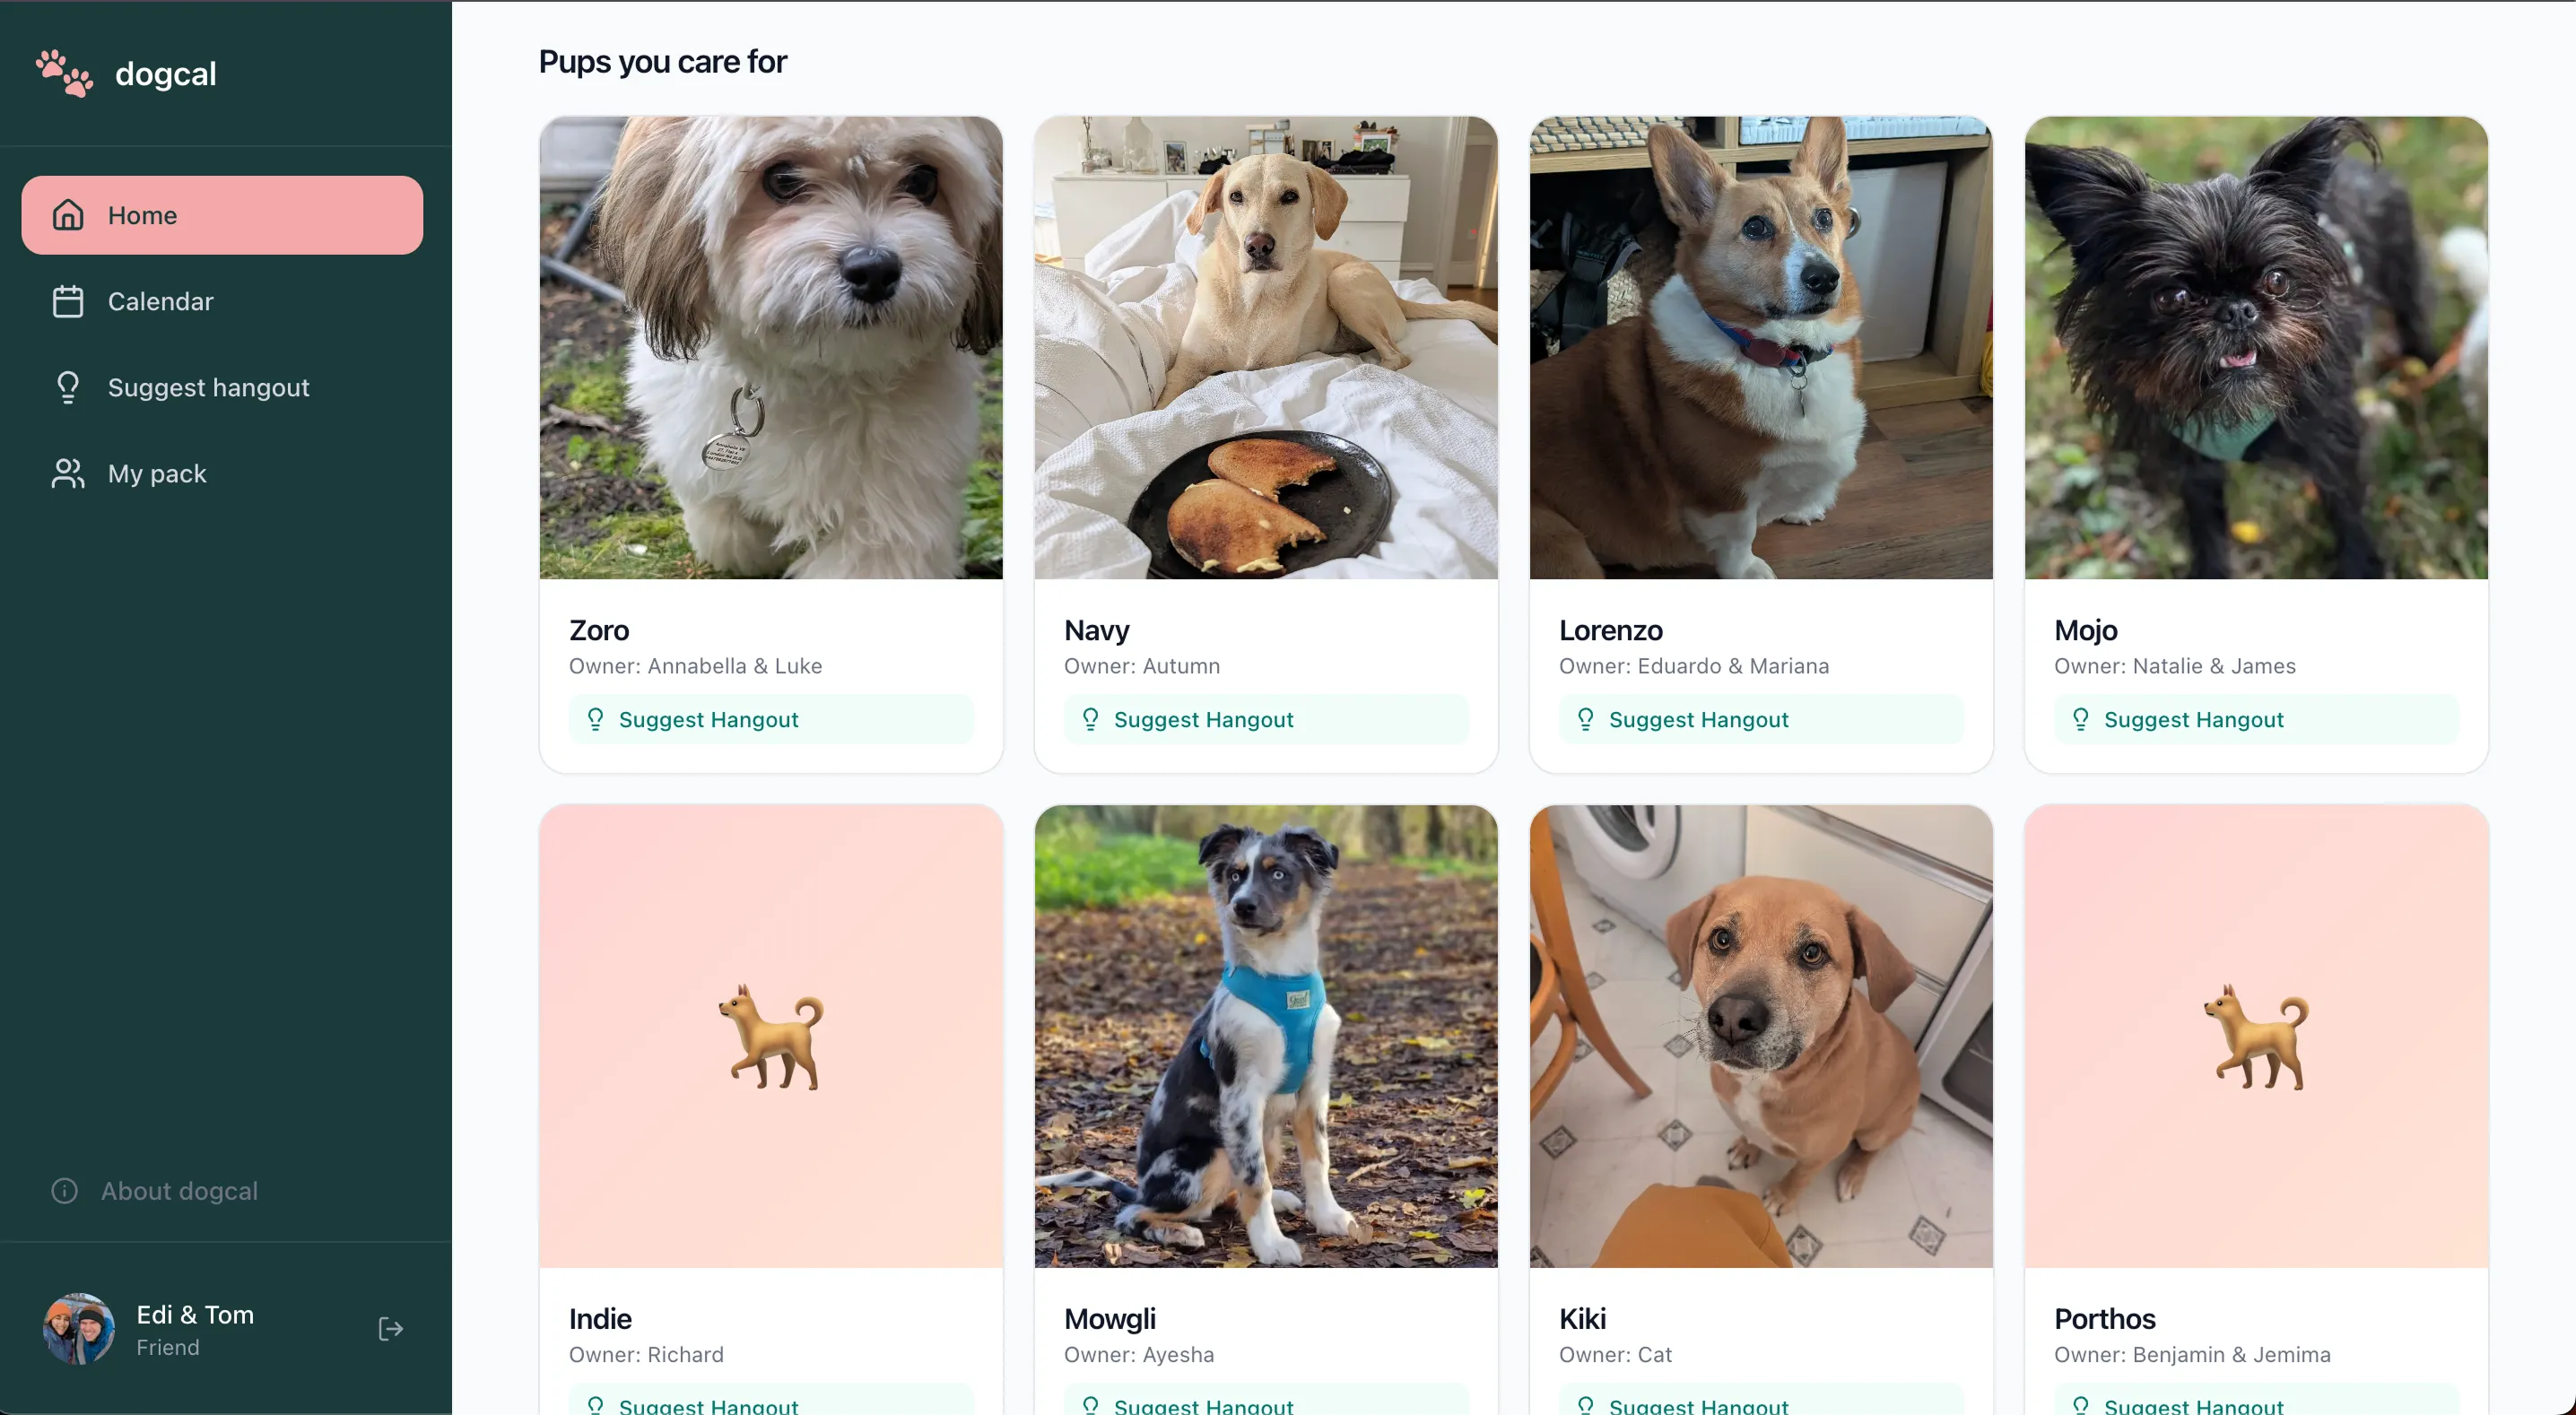
Built and launched Dogcal
Project
Designed and built an alpha product for coordinating shared dog care, informed by early-user testing
Created an agent-assisted delivery pipeline across ticket workflows, automated testing, PR tracking and continuous deployment to Vercel
+ 2025 – ongoing
AI adoption and internal tooling
Rainforest Alliance
Led AI adoption across technical and non-technical LandScale teams and supported the wider Rainforest Alliance rollout
Used hands-on experimentation to shape product workflows and AI-enabled features, with clear guardrails for data quality and human judgement
+ 2025
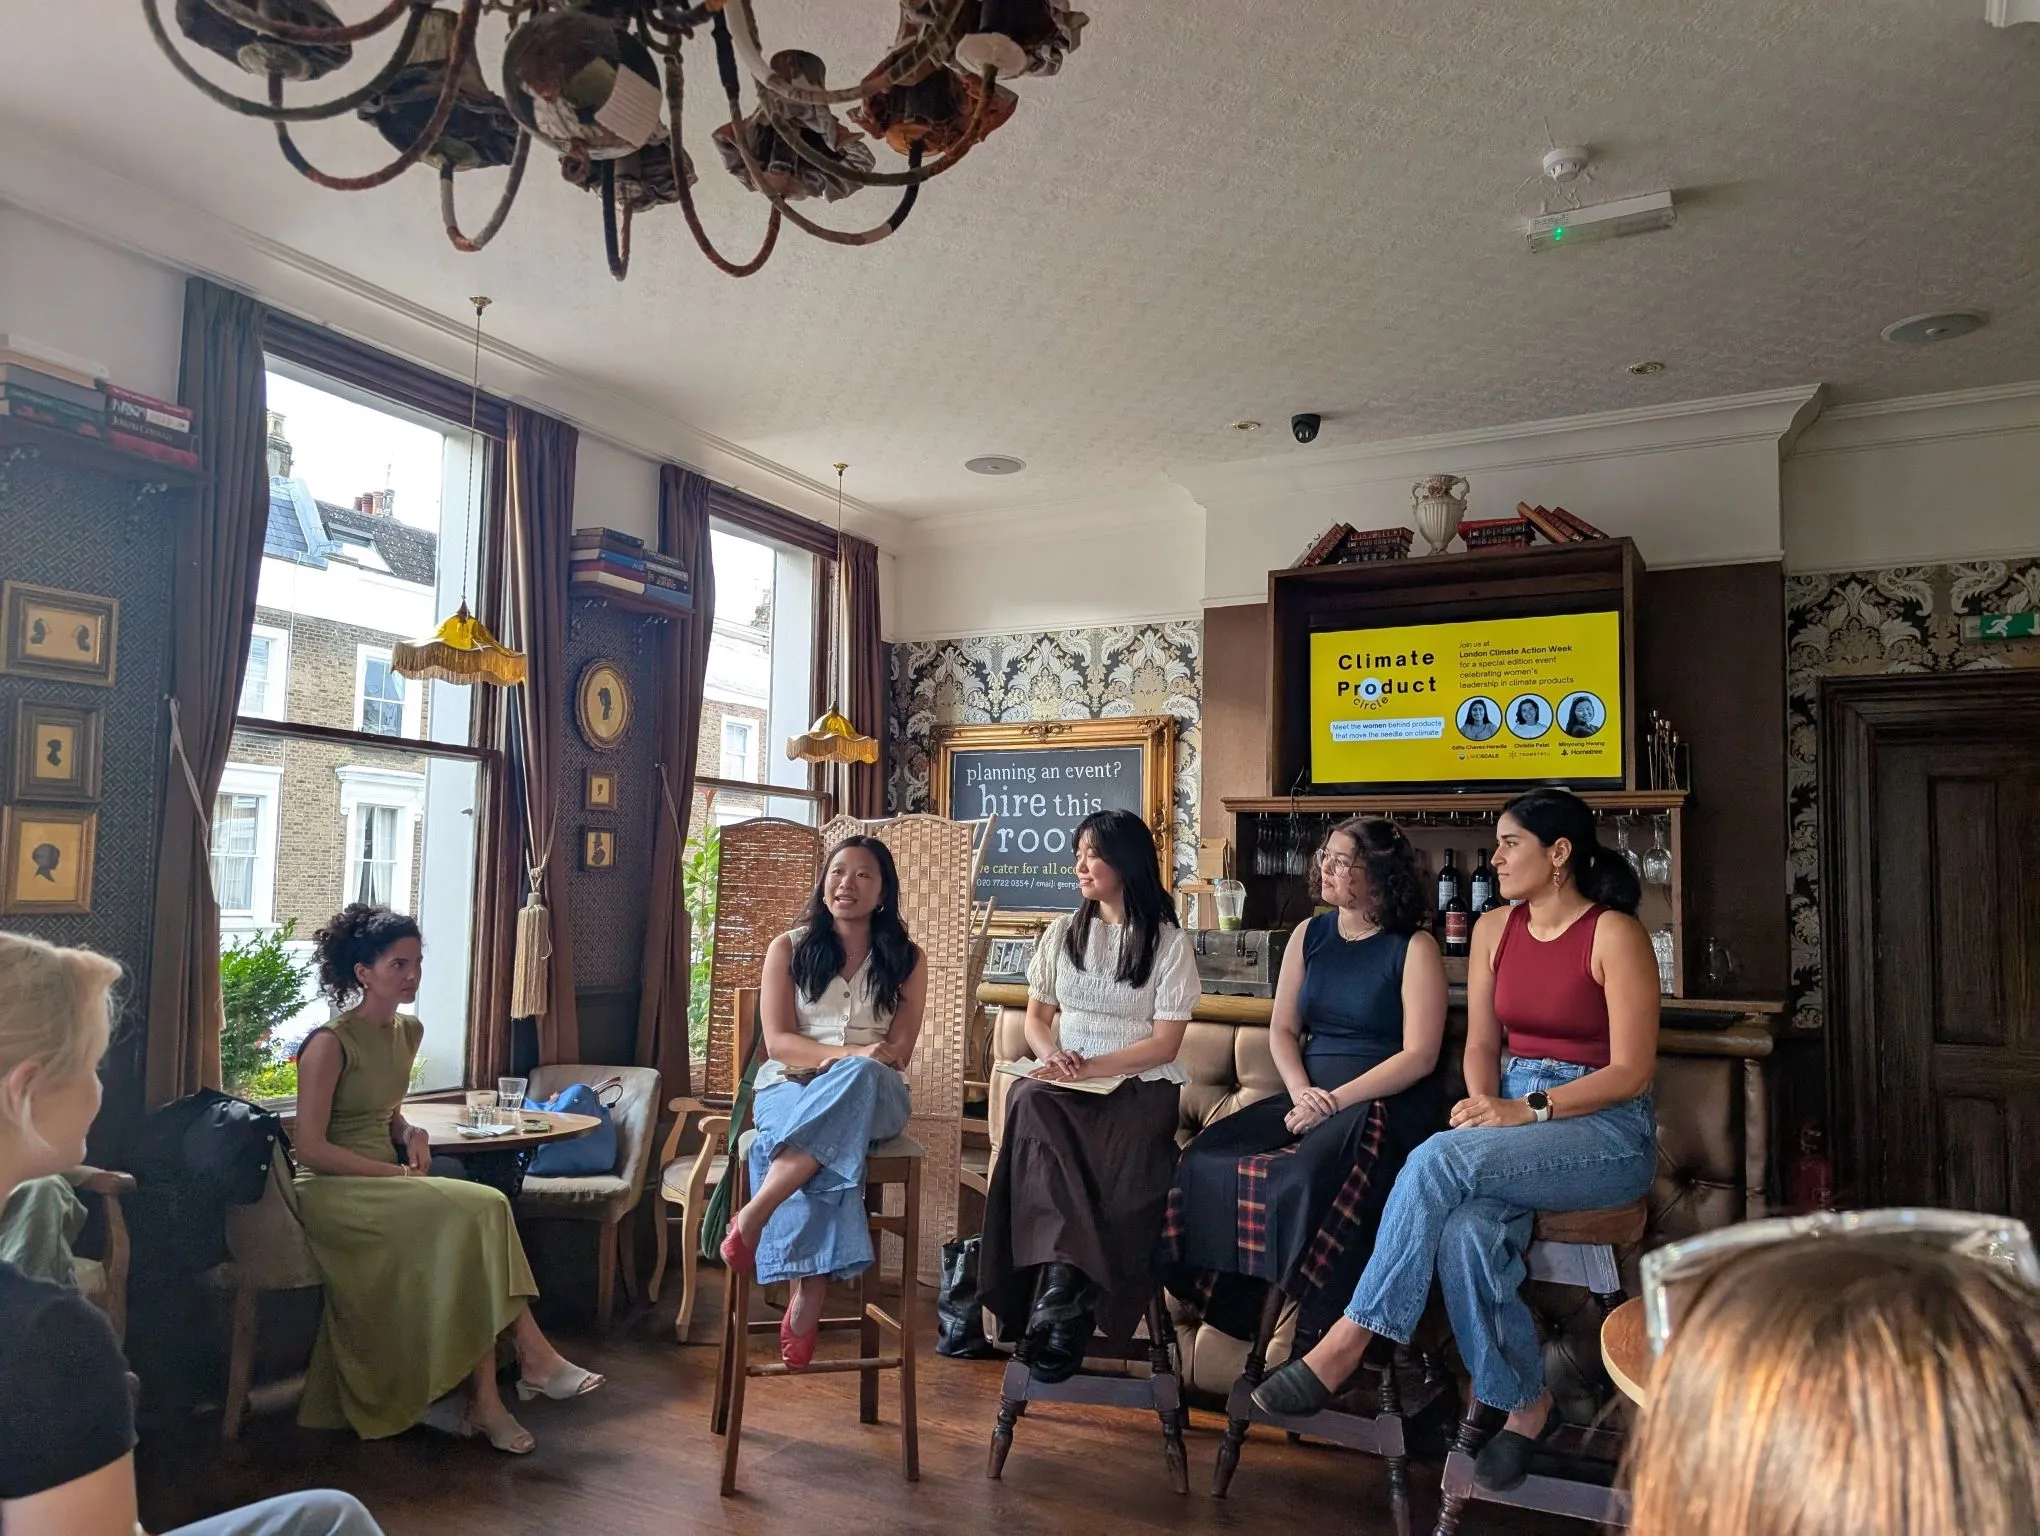
Panel speaker
Climate Product Circle · London Climate Week
Spoke on building climate data products and navigating complex product environments
+ 2026 – ongoing
Research and ecosystem leadership
Advisory work · 1000 Landscapes
Advised researchers on triangulating sustainability data across SourceUp, CDP and LandScale
Founding member of 1000L’s Data and Technology Working Group, contributing product and data-platform experience